Widely followed crypto analyst Rekt Capital says that Bitcoin (BTC) is completing a classic technical pattern that hints at lower prices to come.
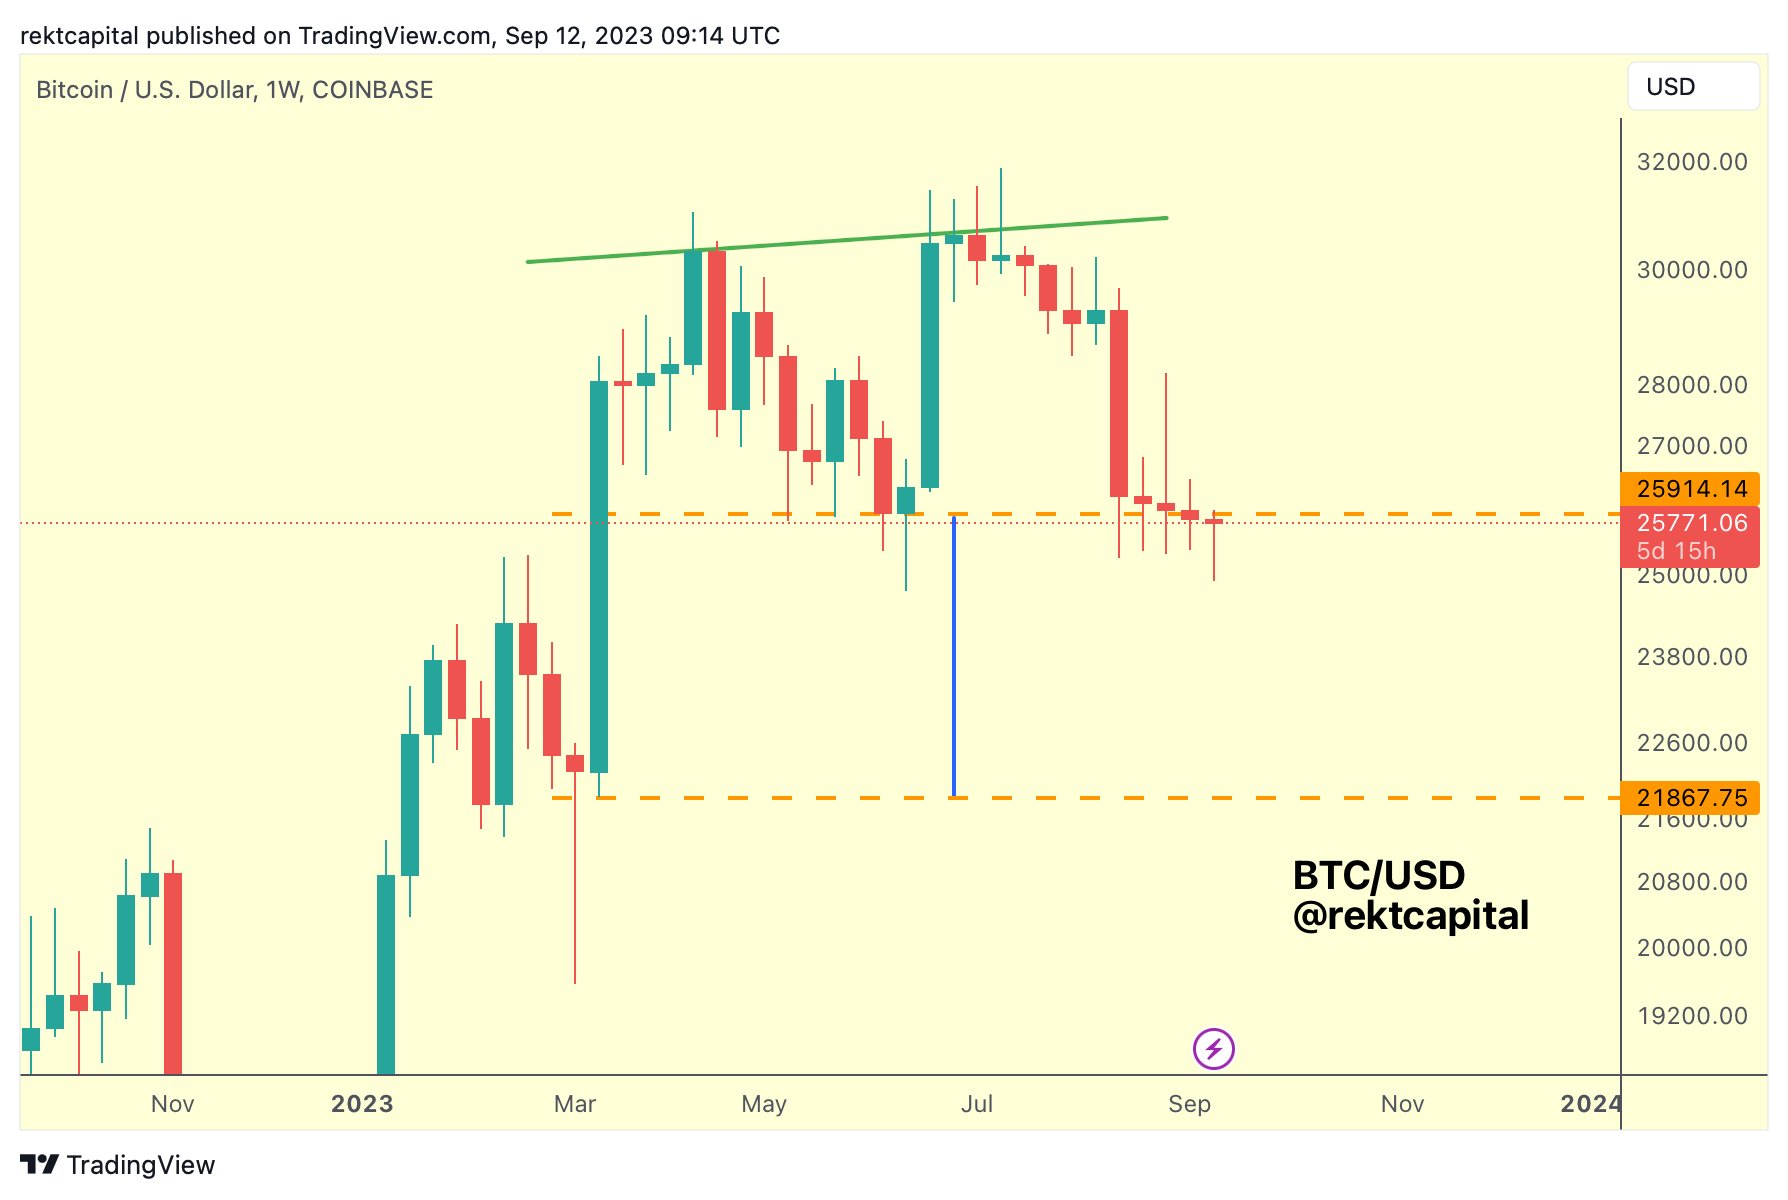
The analyst tells his 351,000 followers on the social media platform X that BTC has almost printed a full double top pattern after being exhausted near the $30,000 range.
Rekt said well over a month ago that if the double top pattern played out, then a move to around $22,000 would be the likely result.
The analyst said in early August,
“If BTC drops to ~$26000 by mid-September then a Double Top may be forming
A breakdown from ~$26000 would validate the DT
And a measured move for the DT would be ~$22000
Worth noting but still very early stages & lots can still change in the meantime.”
Now, with BTC hovering at the $26,000 mark, the analyst says that the double top (DT) pattern is now in play.
“The BTC Double Top is happening
Slowly but surely.”
Source: Rekt Capital/X
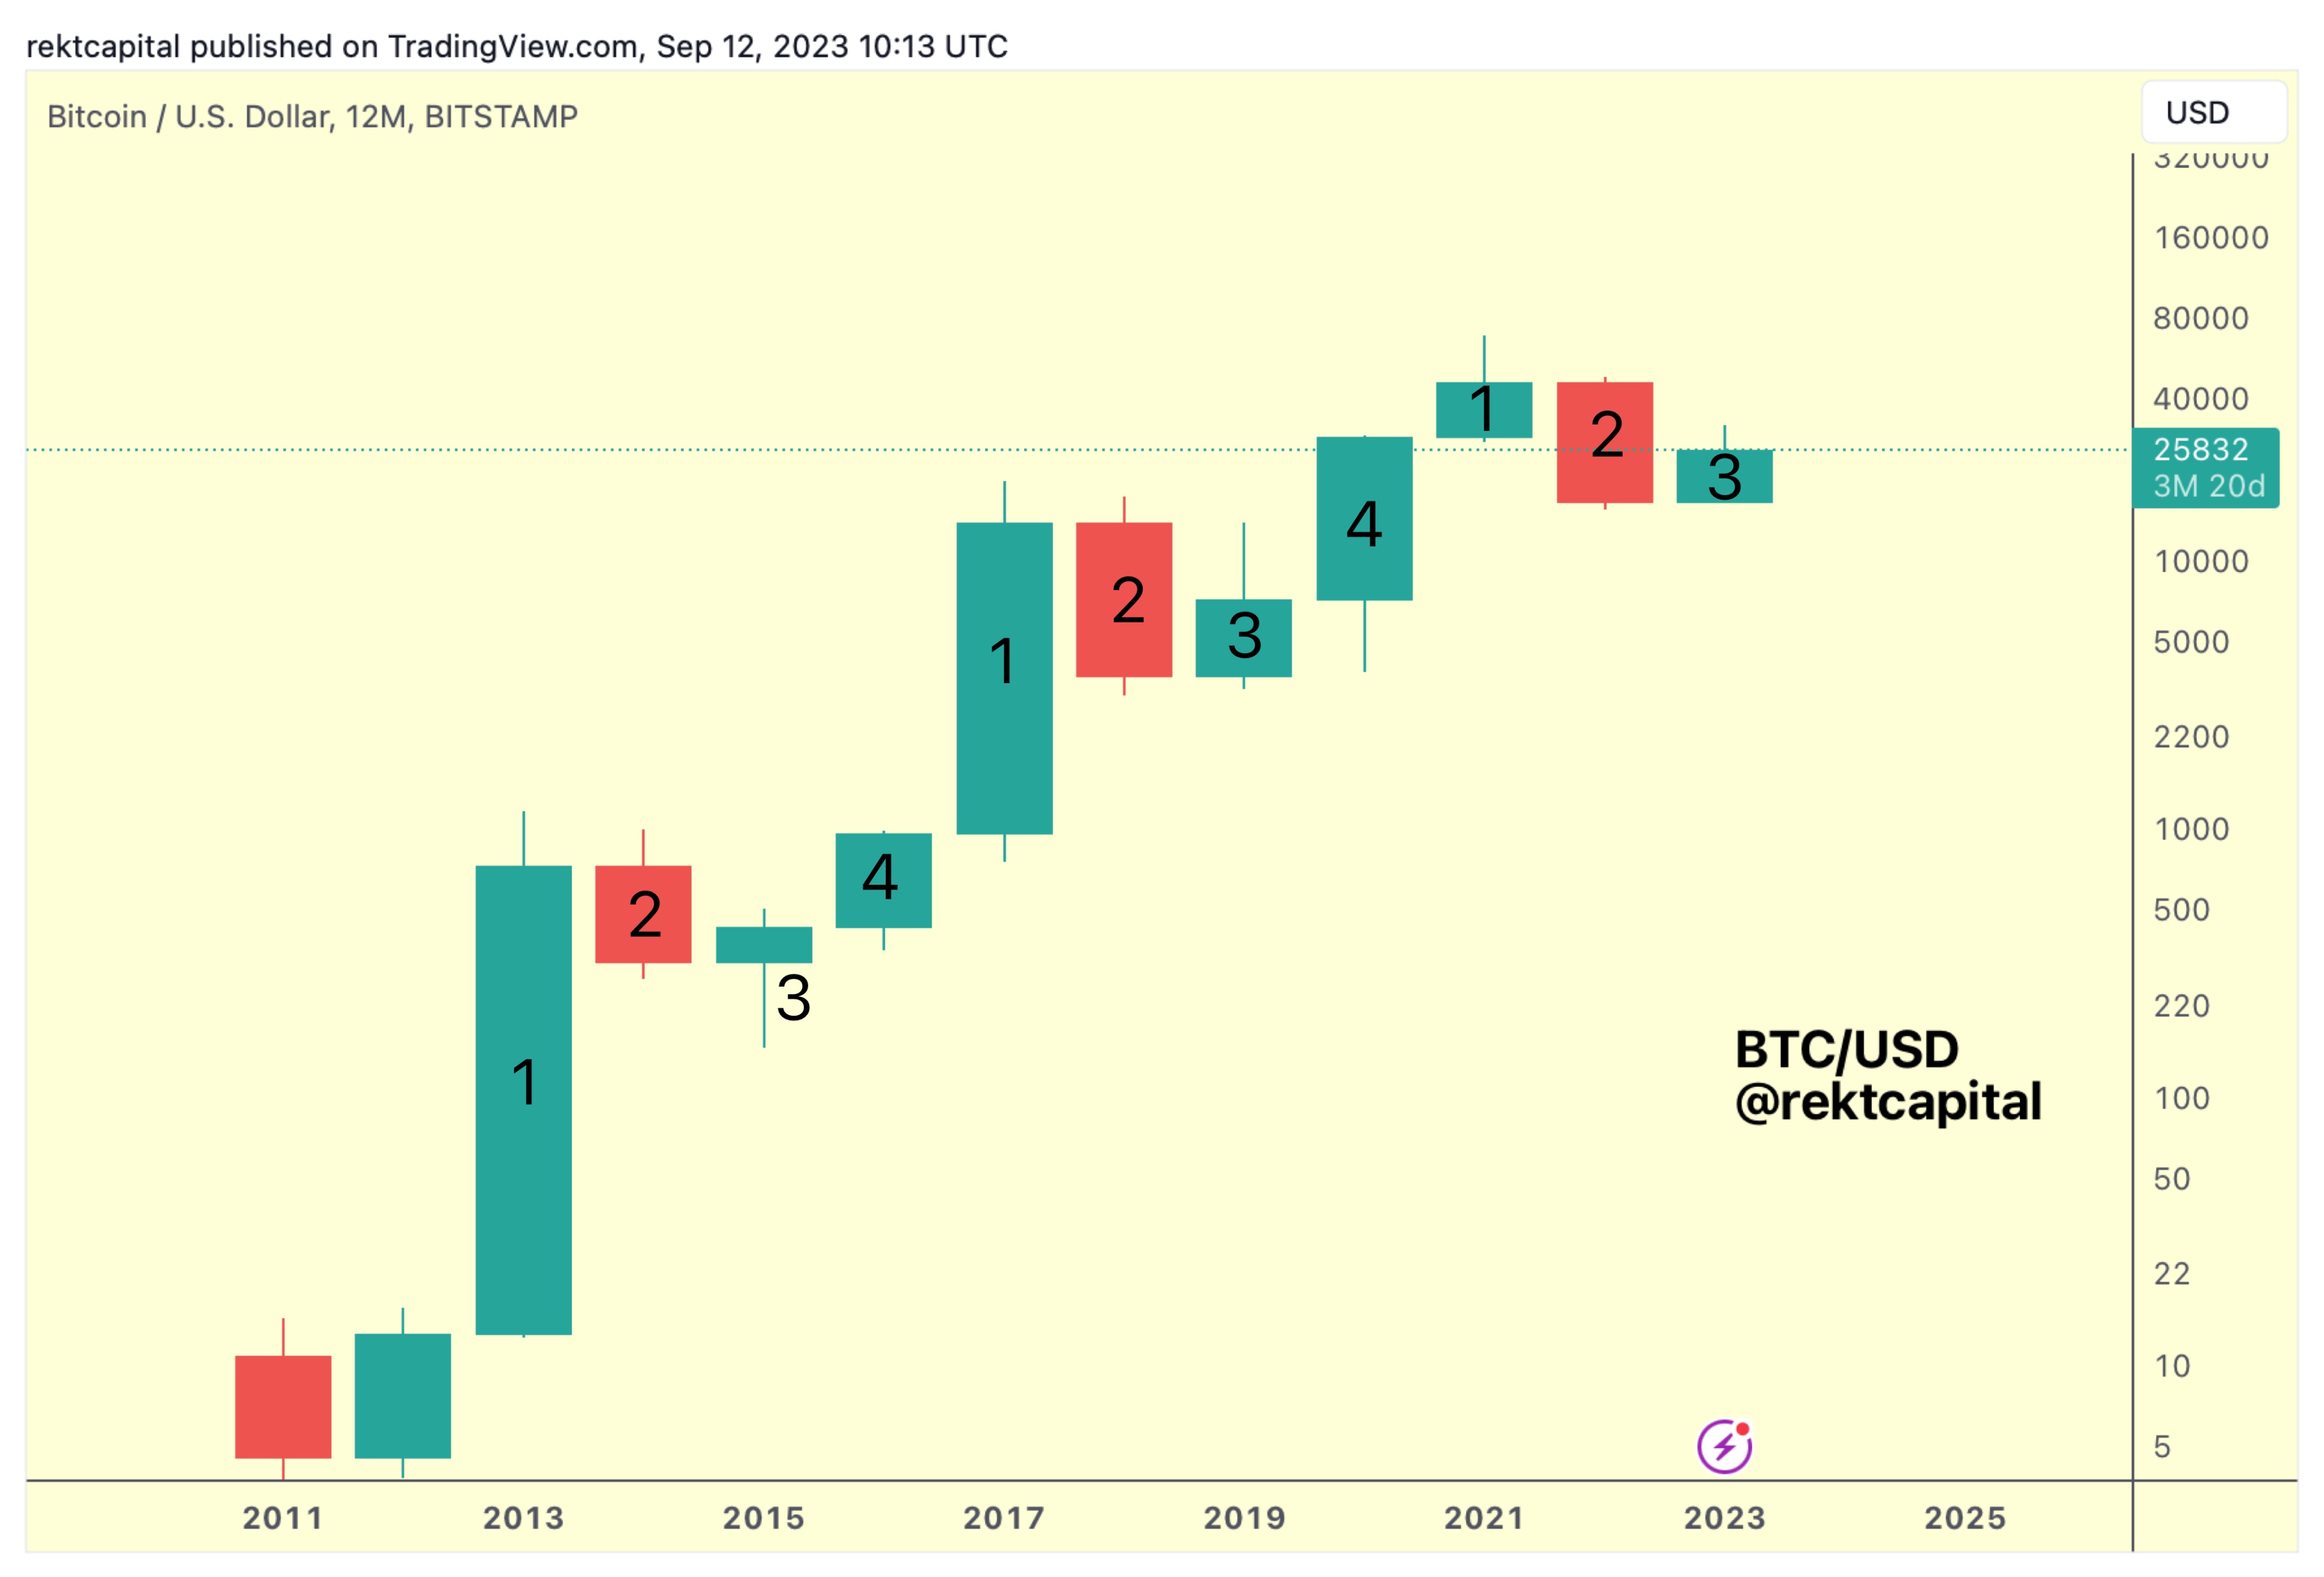
Zooming out on the long term, Rekt looks at Bitcoin using yearly candles to depict BTC’s traditional four-year cycles.
According to the analyst, the third year of each cycle often has both upper and lower wicks on its candle as price historically trades sideways above and below the yearly open. However, Rekt says Bitcoin is unlikely to dip below its yearly open this time around.
“In the BTC Candle 3, we tend to see both upside and downside wicks
2015 & 2019 show that upside wicks tend to happen later in the year
And downside wicks tend to happen earlier in the year
At this stage, it’s unlikely $BTC will form a downside wick in 2023.”
Source: Rekt Capital/X