In the last two months, the Binance Coin price has displayed a correction trend. The coin price trajectory has evolved into a falling wedge pattern, characterized by its declining peaks and troughs confined within two converging trend lines. In the midst of recent crypto market fluctuations, BNB felt the pinch, retracing from its overhead resistance for the third time. This led to an 8.5% decline, positioning the coin at the $214 mark. Will the downtrend extend further?
Also Read: Fintech Owner Uses Bitcoin Scheme To Launder Drug Money Via Binance
Will Wedge Pattern Lead to Bullish Recovery?
- The coin buyers face dynamic resistance from the overhead trendline.
- A bullish breakout from the falling wedge pattern would give an early sign of trend reversal
- The intraday trading volume in the BNB coin is $454.4 Million, indicating a 40 gain
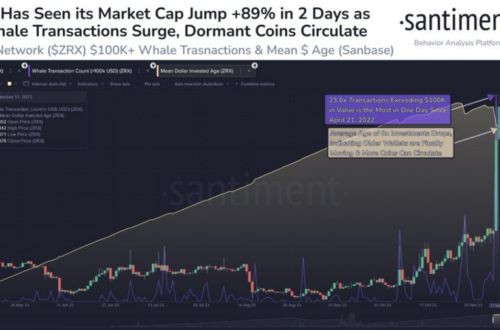
 Source- Tradingview
On August 31st, the BNB price dipped below the $220 local support, suggesting the possibility of further bearish movement. However, with the current market uncertainty, the falling price turned sideways with neither buyers nor sellers making a decisive move.
Therefore, if the recent breach below $220 proves ineffective, it will pave the way for buyers to challenge the overhead resistance. The falling wedge pattern also termed an ending diagonal pattern is often an indicator of the exhaustion of a prevailing bearish phase, pointing towards a potential trend reversal.
A successful breakout from this wedge pattern would signal a bullish turnaround, potentially propelling the BNB price to targets of $234, and if momentum persists, to $247 or even $263.
Will the BNB Price Fall to $200?
While the pattern inherently has bullish undertones, as long as the two trendlines remain intact, the BNB price downtrend could continue. Thus, persistent selling pressure might even push the coin below the psychological level of $200.
- Bollinger Band: The narrow range of the Bollinger Band indicator reflects high volatility in the market
- Average Directional Index: The falling ADX slope indicates a weakening of bearish momentum.