
Markets are on bull activity today, with the global market cap sitting 0.41% above its previous 24-hour mark, as the total cap stands at $1.41T as of press time. The fear and greed index is at 77, as greed still dominates. The global trading volume is 24% down in 24 hours, at $51.8B as of press time.
Bitcoin price analysis
Bitcoin (BTC) has started on minor bull activity, as Bitcoin price stood at $37.1K as of press time after recording a daily decrease of 0.14% and a weekly rise of 5.9%. As a result of the Bitcoin price, the token’s trade volume dropped by 40% during the same period and is presently at $12.9B.
The Bollinger bands are converging, showing dropping volatility levels on Bitcoin Price. The Relative Strength Index (RSI) is above the average line in the overbought region, showing bull dominance on Bitcoin price.
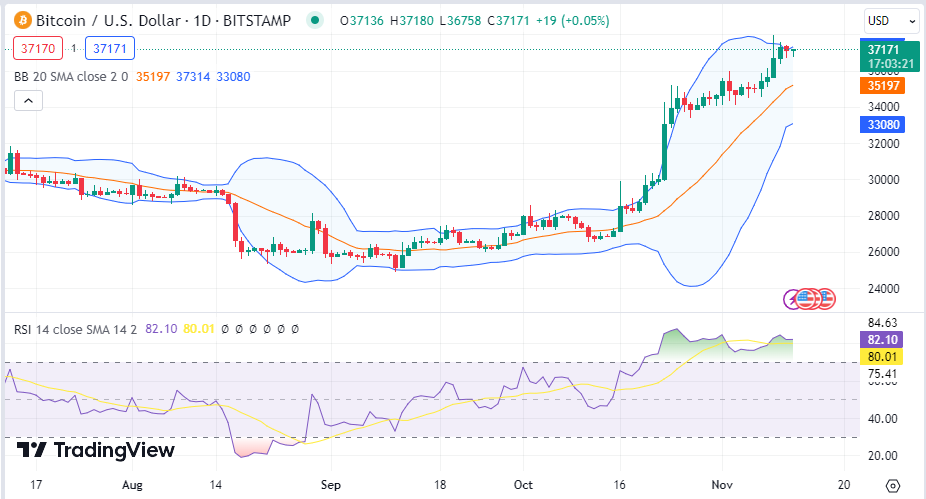
BTC 1-day chart | Source: TradingView
Ethereum price analysis
Ethereum (ETH) has started on minor bear activity, as Ethereum price stood at $2054 after recording a daily decrease of 0.12%, as the weekly rise now stands at 9.3%. ETH’s trade volume dropped by 32% during the same period and is presently at $9.1B.
The Bollinger bands are diverging, showing high volatility levels on Ethereum Price as the Relative Strength Index (RSI) is above the average line in the overbought region, showing bull dominance on Ethereum price despite today’s dip.

ETH 1-day chart | Source: TradingView
SUI price analysis
Sui (SUI) has started on bull activity, as SUI price stood at $0.5891 after recording a daily increase of 1.3%, as the weekly rise now stands at 17%. SUI’s trade volume dropped by 29% during the same period and is presently at $172M.
The Bollinger bands are diverging, showing high volatility levels on Sui Price as the Relative Strength Index (RSI) is above the average line close to the overbought region, showing bull dominance on Sui price.

SUI 1-day chart | Source: TradingView
Terra price analysis
Terra (LUNA) has also started on bear activity, as Terra price stood at $0.069 after recording a daily decrease of 5%, as the weekly rise now stands at 53%. LUNA’s trade volume dropped by 65% during the same period and is presently at $299M.
The Bollinger bands are diverging, showing high volatility levels on Luna Price as the Relative Strength Index (RSI) is above the average line close the overbought region, showing bull dominance on Luna price despite the price drop today.

LUNA 1-day chart | Source: TradingView
FTX Token price analysis
FTX Token (FTT) has started on bear activity, as FTT price stood at $3.4 after recording a daily decrease of 21%, as the weekly rise now stands at 202%. FTX’s trade volume dropped by 36% during the same period and is presently at $533M.
The Bollinger bands are diverging, showing high volatility levels on FTT Price as the Relative Strength Index (RSI) is above the average line in the overbought region, showing bull dominance on FTT price despite today’s price drop.

FTT 1-day chart | Source: TradingView