The Polygon (MATIC) price has increased swiftly since validating an ascending parallel channel on October 27.
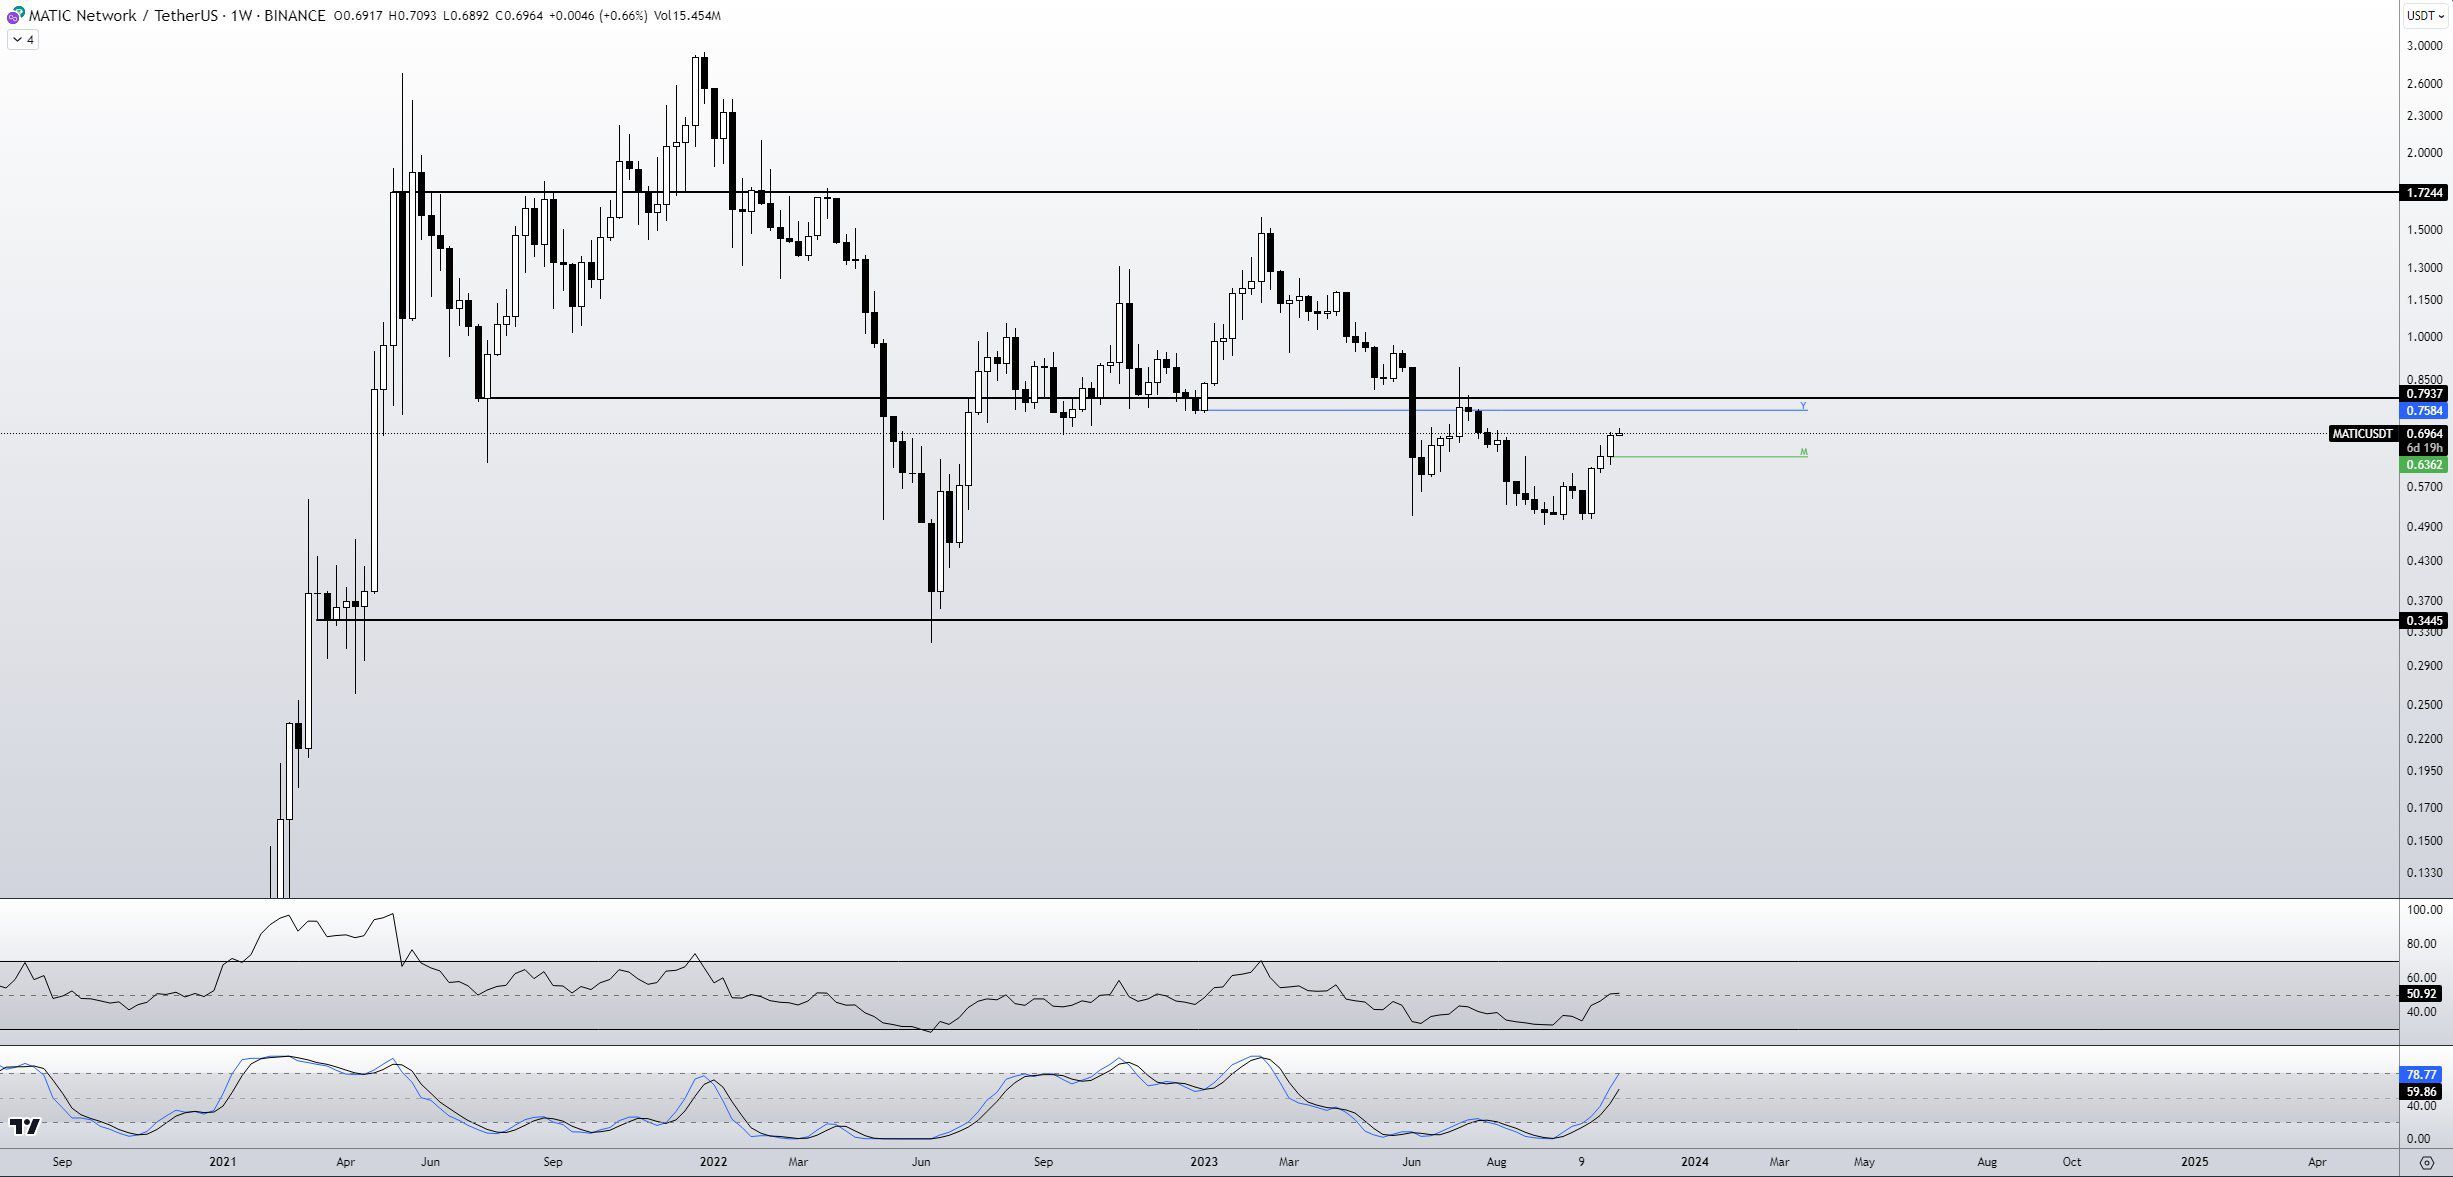
MATIC is approaching a key long-term horizontal resistance level at $0.85, which has not been reached since April.
MATIC Reclaims Horizontal Resistance
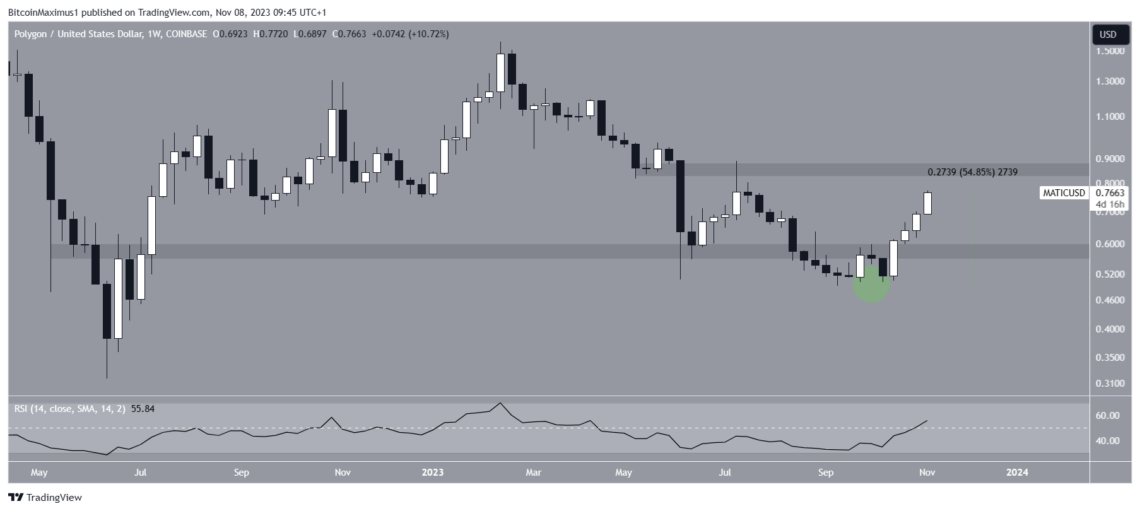
A look at the weekly timeframe technical analysis shows that the price of MATIC has risen over the past four weeks. This upward movement has resulted in the price reclaiming the $0.60 horizontal level.
This particular level holds significance as it had previously acted as a support zone since July 2022. Although the price temporarily dipped below this level in September (green circle), it has now regained it. This suggests that the earlier decrease was merely a deviation.
During this upward movement, the MATIC price has increased by 55%.
The weekly Relative Strength Index (RSI) is bullish. The RSI serves as a momentum indicator, where traders can assess whether a market is in an overbought or oversold condition, helping them decide on whether to buy or sell an asset.
When the RSI reading is above 50 and the trend is upward, it favors the bulls. Conversely, when the reading falls below 50, it indicates the opposite.
The RSI is increasing and has crossed above 50, both signs of a bullish trend.
A report on the state of MATIC in Q3 2023 shows a significant decrease in revenue compared to Q2. More specifically, revenue fell from $11.4 million to $5.1 million. However, there is a slight increase in average daily active addresses and a 50% increase in average daily NFT sales volume.
The Polygon Labs team announced that Polygon Connect will be in Bengaluru on December 7. Polygon Connect is a global gathering of builders and tech enthusiasts that includes panels, keynotes from industry leaders, and technical workshops.
What Are the Analysts Saying?
Cryptocurrency analysts on X (formerly Twitter) are bullish on the future MATIC price trend, especially in the long term.
MayorOfMatic believes that the bottom is in because of the break from a long-term descending resistance trendline.
A similar outlook was given by 52kskew, who outlined the importance of the $0.85 level by stating:
“1W – HTF there’s potentially a higher low forming here in which the confirmation would be a higher high above $0.85 & Yearly open is a very strong confluence level for alts generally”
However, he expressed skepticism about the sustainability of the short-term rally due to significant overhead resistance.
CasiTrades gives a similar possibility for a short-term decrease. She uses Elliott Waves to conclude that a short-term five-wave increase is complete.
By studying recurring long-term price patterns and investor psychology, technical analysts utilize the Elliott Wave theory to ascertain the trend’s direction.
Read More: Best Crypto Sign-Up Bonuses in 2023
MATIC Price Prediction — How Long Will Increase Continue?
The daily timeframe technical analysis gives a positive outlook based on both the price action and the RSI.
The price action shows that MATIC broke out from an ascending parallel channel on October 22. Subsequently, on October 27, it revisited this channel, confirming it as a support level (green icon).
Typically, such channels tend to contain corrective price movements, and the breakout from this channel suggests that the current upward movement signifies the start of a new bullish trend.
The reading from the RSI is bullish as the indicator is increasing and is above 50. These are both signs of a bullish trend.
The closest resistance area is found at $0.85, only 10% above the current price. If the MATIC price successfully breaks out above it, it would have the potential to increase by another 60% and reach the $1.25 resistance area. This resistance level has not been touched since March.
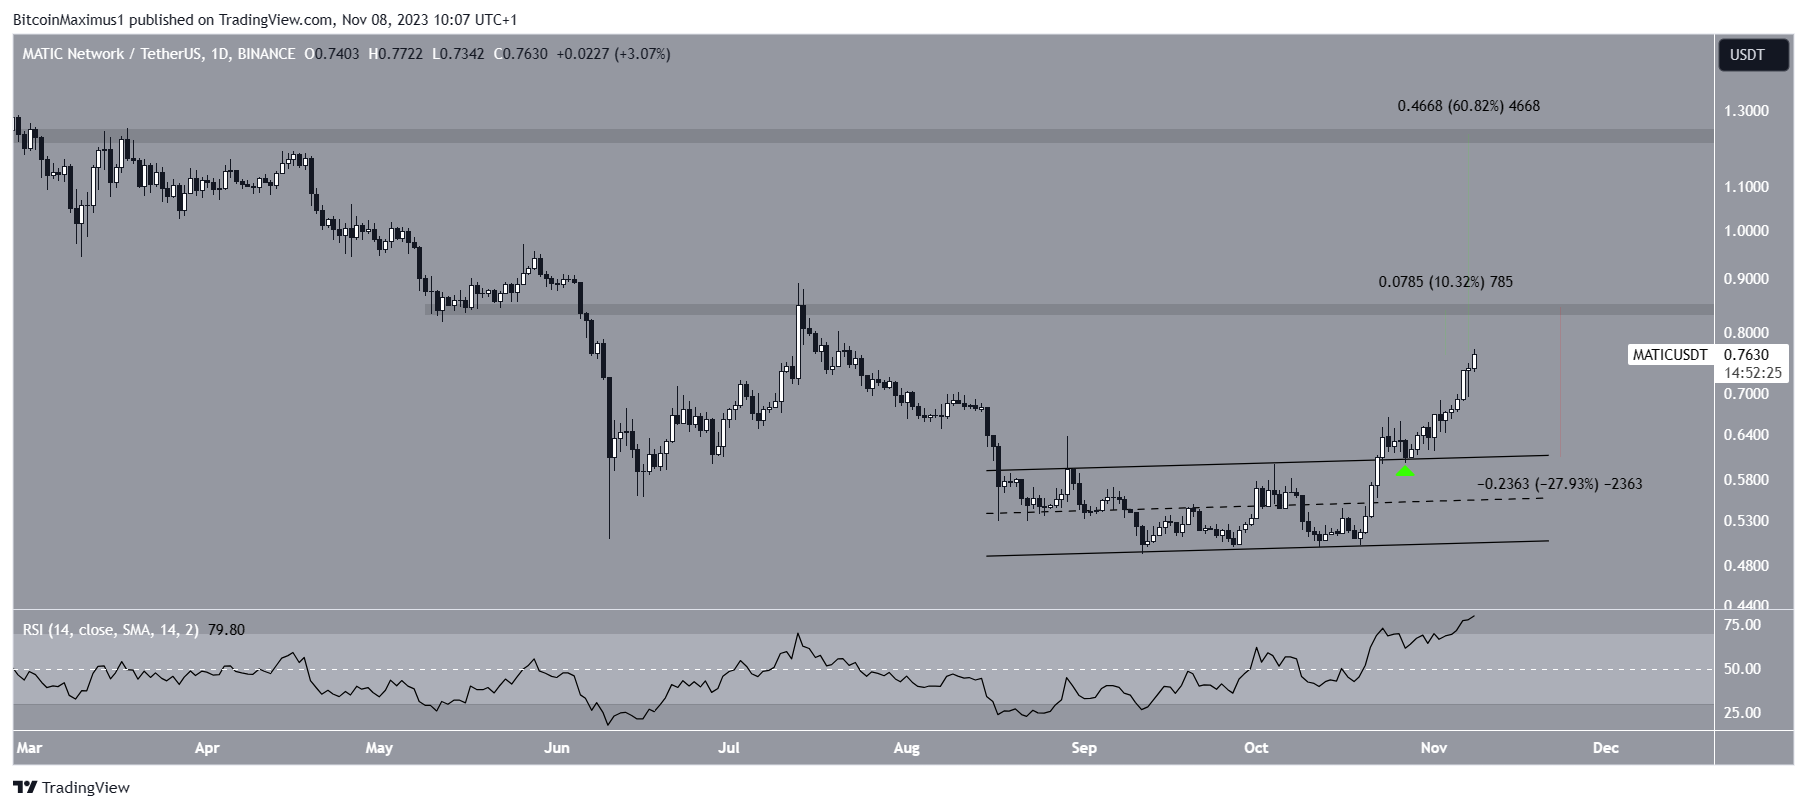
Despite this bullish MATIC price prediction, failure to break out from the $0.85 resistance area can lead to a 28% drop that would validate the channel’s resistance line at $0.61.
Interested in AI Trading? 9 Best AI Crypto Trading Bots to Maximize Your Profits
For BeInCrypto’s latest crypto market analysis, click here.
Disclaimer
In line with the Trust Project guidelines, this price analysis article is for informational purposes only and should not be considered financial or investment advice. BeInCrypto is committed to accurate, unbiased reporting, but market conditions are subject to change without notice. Always conduct your own research and consult with a professional before making any financial decisions.

Sponsored