After a positive October, the Solana (SOL) price reached a new yearly high of $46.90 on November 1.
While SOL failed to close above the $47 resistance area, it is currently making another attempt at moving above it.
Solana Reaches $47 Resistance Area
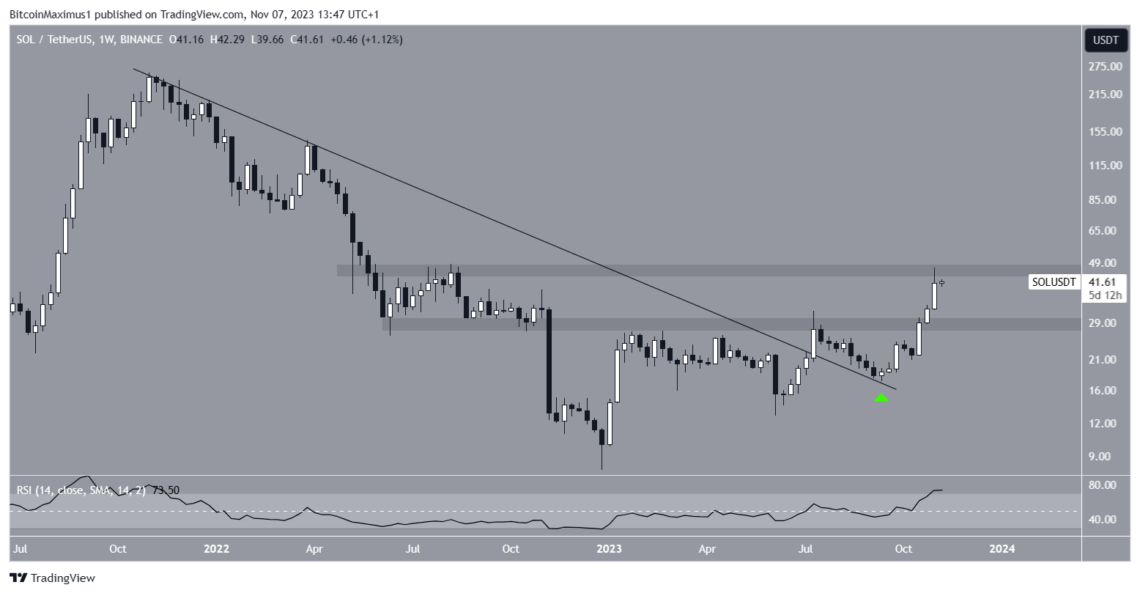
In July, the price of SOL experienced a significant breakthrough, surpassing a descending resistance trendline that had been in place for an extended period.
In September, this trendline was confirmed as a reliable support level (green icon), leading to an acceleration in SOL’s upward momentum.
Afterward, SOL managed to surpass a crucial hurdle at the $28 horizontal resistance area. Following this breakout, SOL achieved a new yearly high, reaching a price of $46.70 today.
However, the price failed to sustain its increase, creating a long upper wick and validating the $47 area as resistance.
The weekly Relative Strength Index (RSI) is bullish.
When evaluating market conditions, traders use the RSI as a momentum indicator to determine whether a market is overbought or oversold and whether to accumulate or sell an asset.
If the RSI reading is above 50 and the trend is upward, bulls still have an advantage, but if the reading is below 50, the opposite is true.
The indicator is above 50 and increasing, both considered signs of a bullish SOL trend.
There were concerns for a potential Solana sell-off since the bankrupt FTX exchange unstaked 3.96 million tokens and moved 750,000 to Binance and Kraken.
However, UnderCldJonny calmed these fears by stating that:
One thing that’s worth noting about FTX’s $SOL holdings: While FTX holds a very large % of $SOL supply, most of it is still locked and will be fully vested in 2028. SOL price can still be impacted in the short term. But not as bad as everyone expects.
Solana Price Prediction: How Long Will Rally Continue?
The SOL daily time frame chart exhibits a clearly bullish trend, primarily attributed to the Elliott Wave count.
Analysts employ the Elliott Wave theory, which involves analyzing repetitive long-term price patterns and investor psychology to determine the direction of the prevailing trend.
The most likely count suggests that SOL is in the third wave of a five-wave upward movement (white). The third wave is often the largest and sharpest of the bullish waves.
Since wave three is 1.61 times the length of wave one, the price may reach a local top soon.
In that case, it could consolidate near the $38-$40 level before completing wave five at $68. This would be an increase of 60%, measuring from the current price.
Additionally, the SOL price may extend wave three further, reaching the $68 region without consolidation. A close above $48 would confirm this.
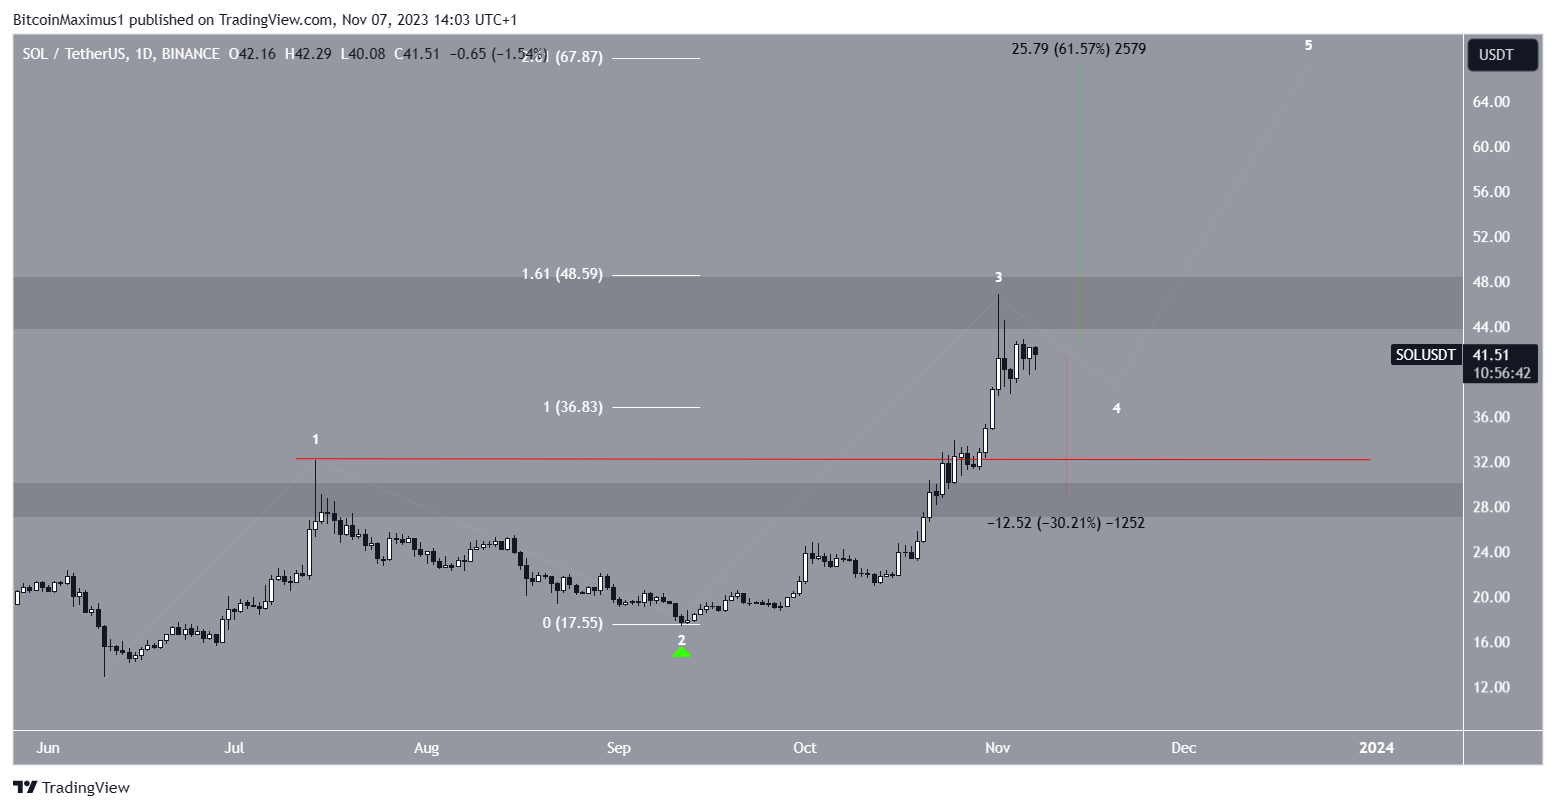
Despite this bullish SOL price prediction, a decrease below the wave one high at $32.13 (red line) will invalidate the count. In that case, the SOL price could fall 30% to the $28 horizontal support area.
For BeInCrypto‘s latest crypto market analysis, click here
Disclaimer
In line with the Trust Project guidelines, this price analysis article is for informational purposes only and should not be considered financial or investment advice. BeInCrypto is committed to accurate, unbiased reporting, but market conditions are subject to change without notice. Always conduct your own research and consult with a professional before making any financial decisions.

Sponsored