The MINA price has increased by 100% over the past 24 hours, culminating with a new yearly high of $0.86.
The altcoin broke out from a long- and short-term descending resistance trendline during the increase.
MINA Doubles in 24 Hours
The MINA price has increased rapidly since the beginning of October. On October 22, it broke out from a descending resistance trendline that had been in place for 168 days.
Today, MINA reached a new yearly high of $0.87, an increase of more than 100% in 24 hours.
During the upward movement, MINA showed considerable strength by moving above the $0.50 and $0.70 horizontal resistance levels without experiencing any retracement at all.
It is possible that the increase was aided by Korean Exchange Upbit announcing that it will list MINA’s Korean currency fiat trading pair.
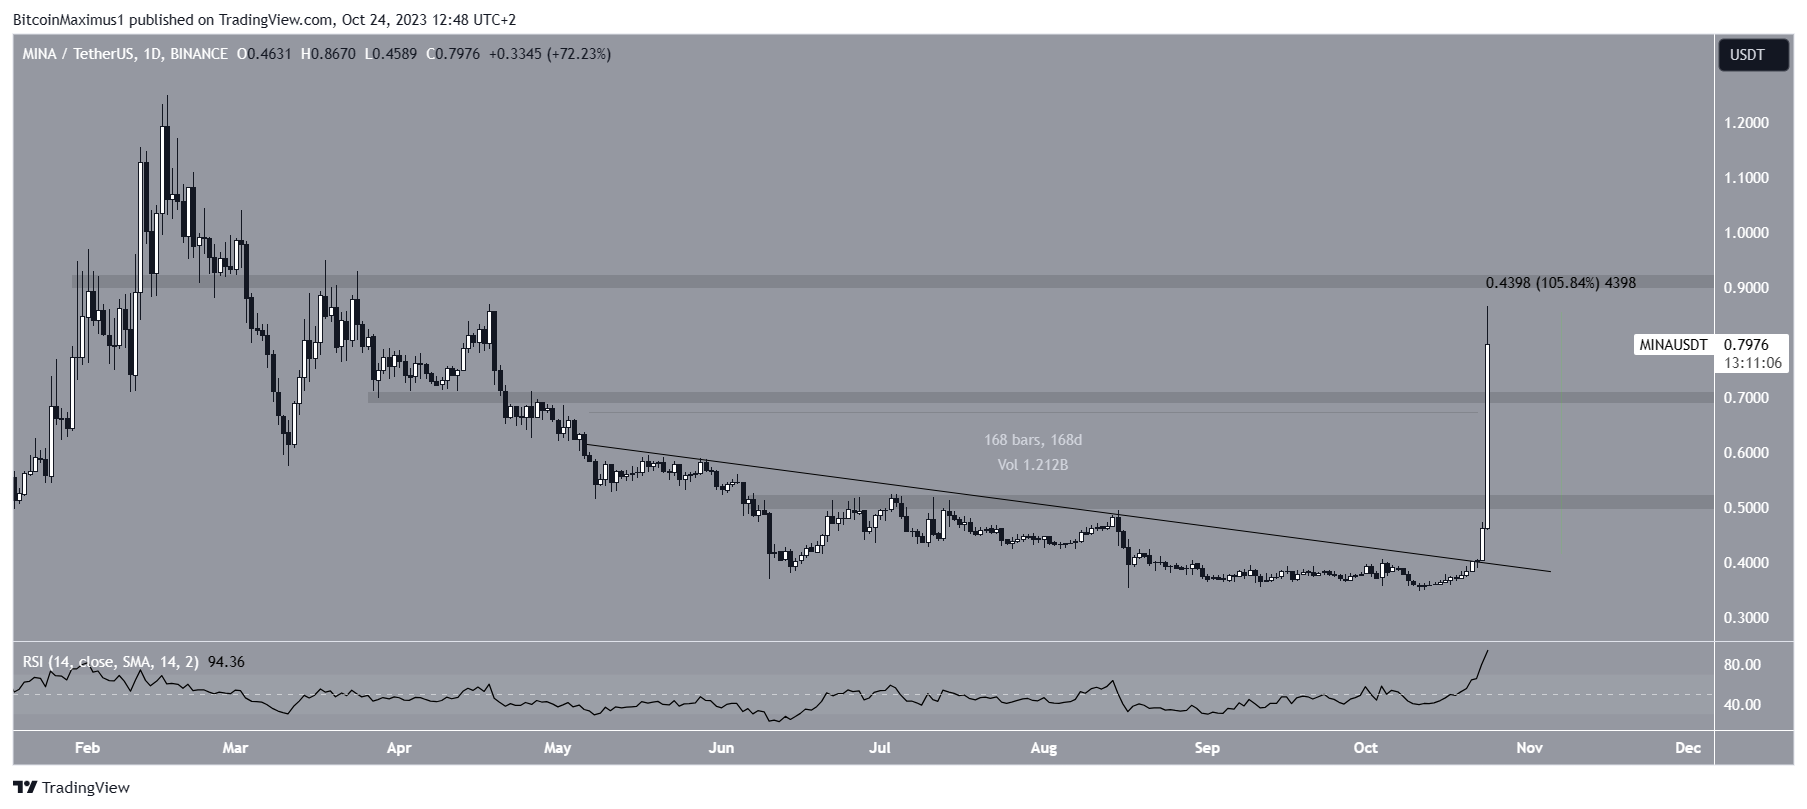
The daily Relative Strength Index (RSI) supports the continuing of the increase.
When evaluating market conditions, traders use the RSI as a momentum indicator to determine whether a market is overbought or oversold and whether to accumulate or sell an asset.
If the RSI reading is above 50 and the trend is upward, bulls still have an advantage, but if the reading is below 50, the opposite is true. The indicator is above 50 and moving upwards, both signs of a bullish trend.
However, it is worth mentioning that the RSI is at an all-time high of 95, showing extremely overbought conditions.
Read More: 9 Best Crypto Demo Accounts For Trading
MINA Price Prediction: Will Price Breakout Above $1?
The weekly timeframe shows an interesting development since the price has broken out from a very long-term descending resistance trendline, which has been in place since the all-time high of $9.90.
While MINA has not reached a weekly close above the trendline, it is considerably above it since the latter is at $0.43.
Similarly to the daily timeframe, the RSI is increasing, supporting the continuing increase.
The main resistance area is at $1. If MINA breaks out above it, it can increase to the next resistance at $3.20, 300% above the current price. This would then be the final resistance before the all-time high.
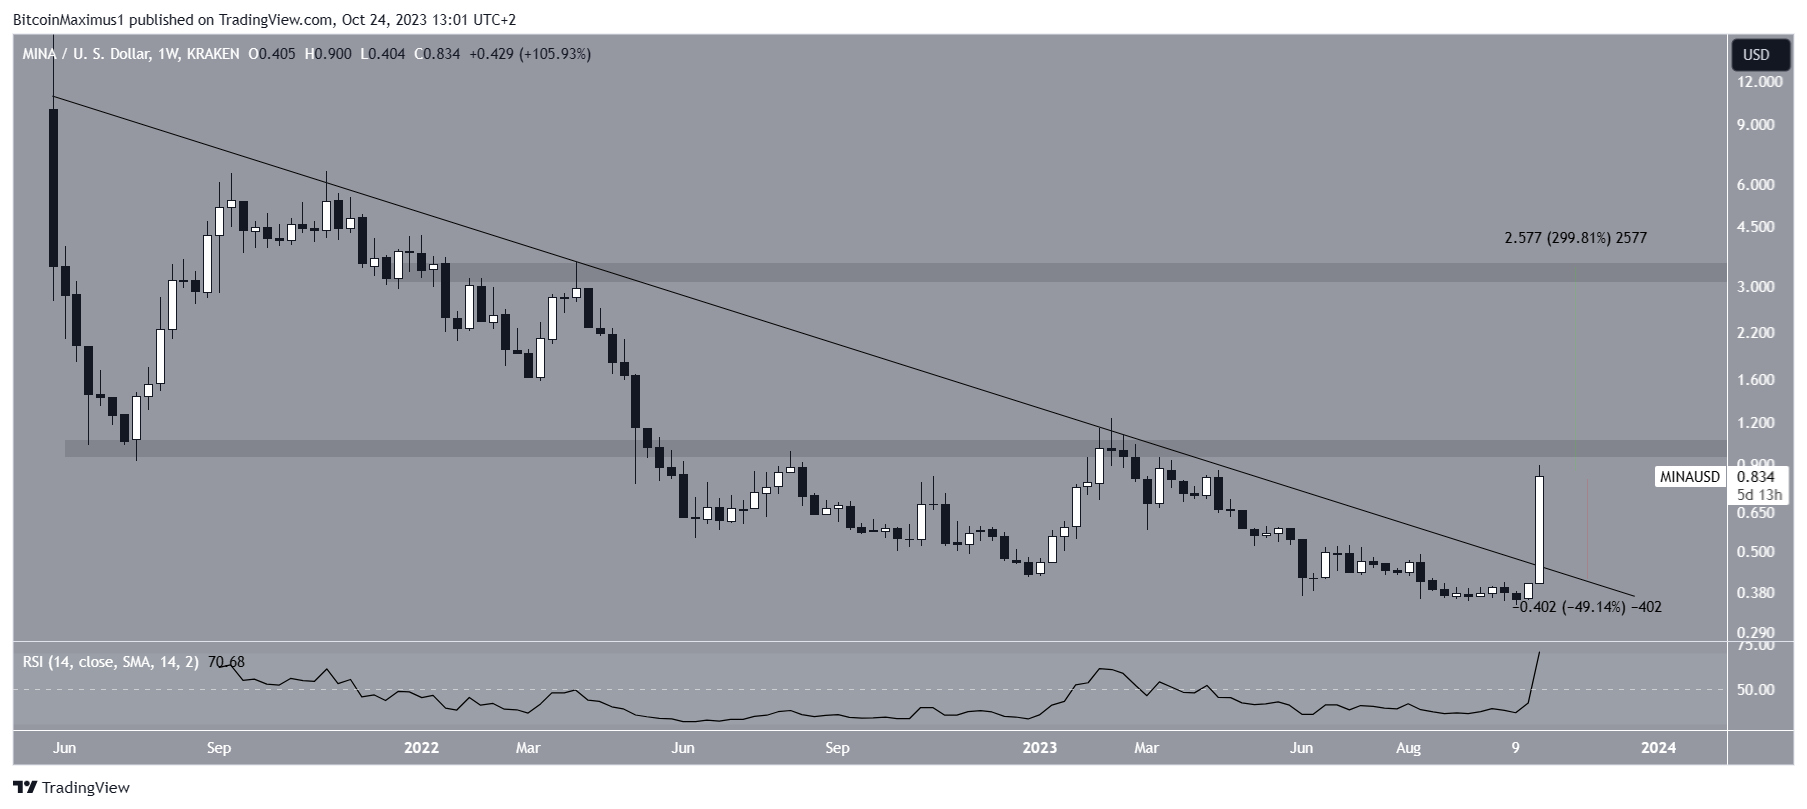
Despite this bullish MINA price prediction, failure to reclaim the $1 area can lead to a 50% drop to the descending resistance trendline at $0.41.
For BeInCrypto‘s latest crypto market analysis, click here.
Disclaimer
In line with the Trust Project guidelines, this price analysis article is for informational purposes only and should not be considered financial or investment advice. BeInCrypto is committed to accurate, unbiased reporting, but market conditions are subject to change without notice. Always conduct your own research and consult with a professional before making any financial decisions.

Sponsored